Introductory Business Statistics: A Future Leader’s Guide

A Turnkey Curriculum for Student Success

Providing educators with a contextually based, student-centered statistics curriculum.

The "Introductory Business Statistics" Courseware

A Cutting-Edge Business Statistics Curriculum

The “Introductory Business Statistics” courseware gives you everything you need to teach students fundamental statistics concepts! This courseware builds a student’s statistics toolkit, helping them develop skills in data collection, correlation and regression, confidence intervals, hypothesis testing, and ethics. With engaging videos and in-text interactive knowledge checks to enhance understanding of difficult concepts, this courseware prepares students to apply statistics to real-life scenarios and make better business decisions.

“Introductory Business Statistics” also contains ready-made resources for educators, including engaging assignments, lesson plans, auto-graded quizzes, lecture slide decks, and more. The resources make it more than a statistics textbook; it’s a comprehensive, turnkey course for your classroom!

Business Statistics Textbook

Table of Contents

Chapter 1: Why Statistics Is So Important in Business

Chapter 2: Data Collection in Business

Chapter 3: Summarizing Data with Descriptive Statistics

Chapter 4: Organizing Data with Charts and Graphs

Chapter 5: Correlation and Regression

Chapter 6: Probability and Independence

Chapter 7: The Normal Distribution

Chapter 8: The Binomial Distribution

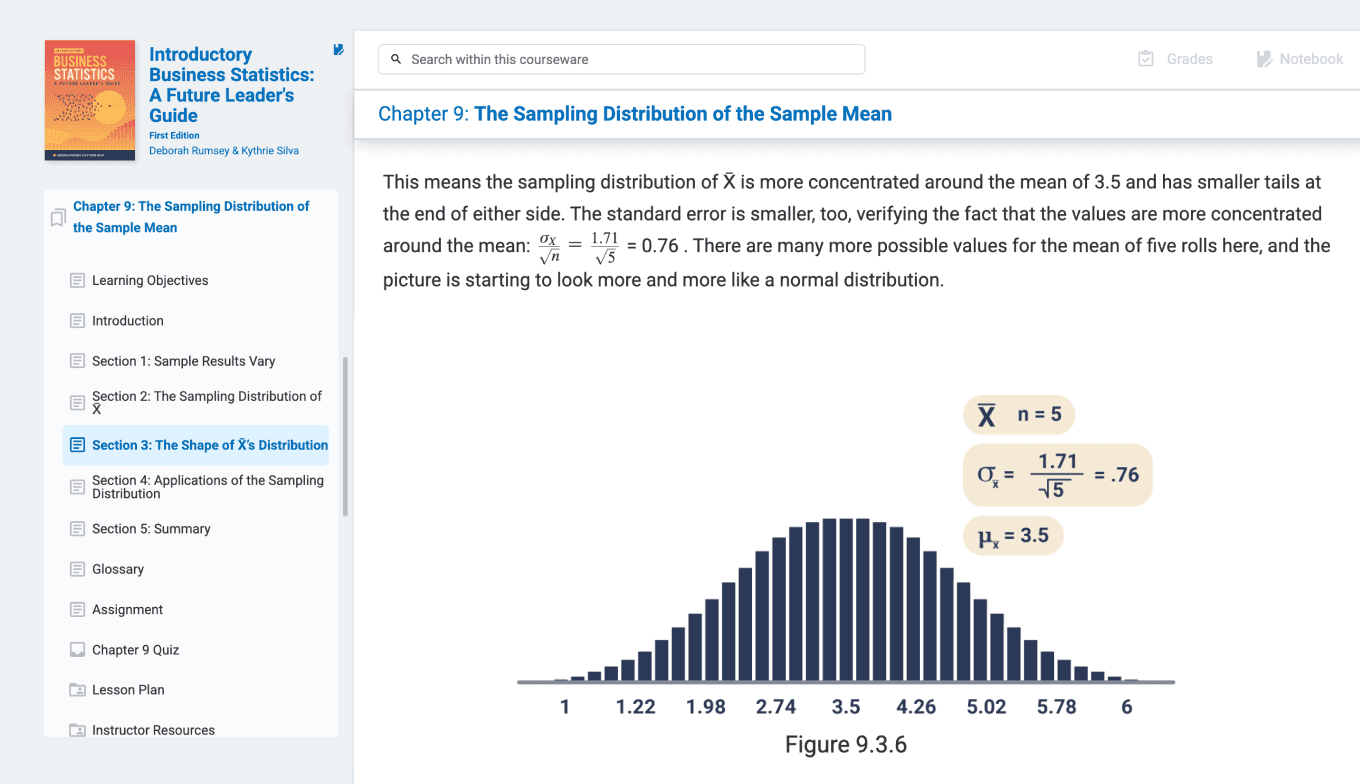
Chapter 9: The Sampling Distribution of the Sample Mean

Chapter 10: Confidence Intervals for the Population Mean

Chapter 11: Hypothesis Testing for the Population Mean

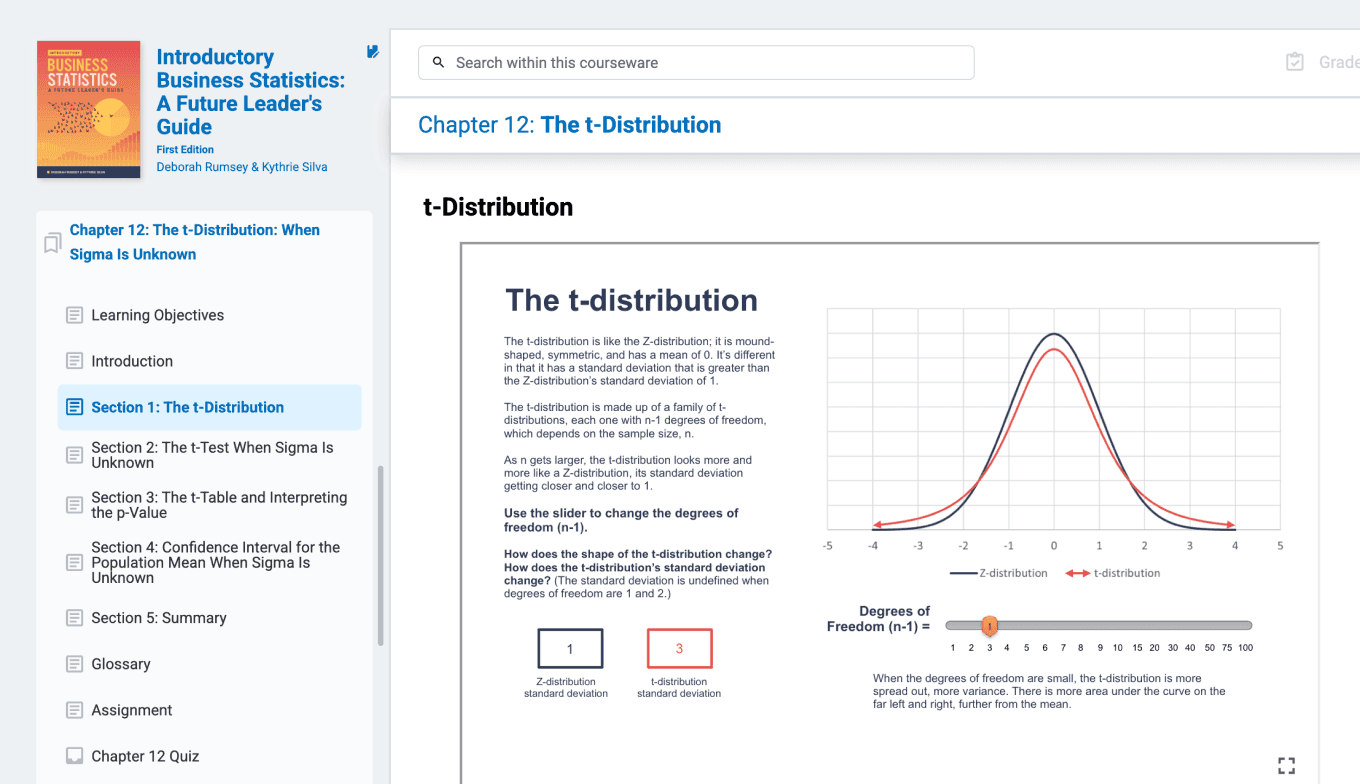
Chapter 12: The t-Distribution: When Sigma Is Unknown

Chapter 13: Hypothesis Tests and Confidence Intervals for Population Proportions

Chapter 14: Using Statistics Correctly and Ethically as a Business Leader

Key Learning Objectives

Chapter 1 Learning Objectives
After reading this chapter, students will be able to: 

  • Explain how data is a part of business and hence a part of statistics
  • Describe how statistics is involved in many areas of business
  • Summarize the importance of effectively communicating statistical concepts and results
  • Recognize that statistics can be misused, and those statistics need to be avoided and/or spotted

Chapter 2 Learning Objectives
After reading this chapter, students will be able to:

  • Define data collection
  • Explain why data collection is important in business
  • Identify three different types of studies for data collection, evaluate the quality of the studies, and give examples of how each can be used to help a business
  • Explain how sampling is used in business and evaluate a sample based on its characteristics
  • Describe different types of sampling plans and how they are carried out
  • Explain how surveys affect a business and critique a survey based on its characteristics

Chapter 3 Learning Objectives
After reading this chapter, students will be able to:

  • Define descriptive statistics
  • Explain how descriptive statistics are used in business
  • Calculate the count and percent for a categorical variable in a data set
  • Name and describe two measures of center and variation in a sample
  • Calculate basic descriptive statistics for quantitative data such as mean, median, standard deviation, interquartile range, percentiles, and quartiles
  • Build the 5-number summary
  • Interpret descriptive statistics for categorical and quantitative data

Chapter 4 Learning Objectives
After reading this chapter, students will be able to:

  • Explain how graphs and charts are important in business
  • Distinguish between different charts and graphs
  • Organize data with charts and graphs
  • Calculate and interpret pie charts and bar graphs from categorical data
  • Calculate and interpret histograms, boxplots, and time charts from quantitative data
  • Describe variability in quantitative data using charts and graphs
  • Identify misleading graphs and describe what is misleading about them

Chapter 5 Learning Objectives
After reading this chapter, students will be able to:

  • Define correlation and regression
  • Explain why correlation and regression are important in business
  • Interpret the correlation and demonstrate its properties
  • Calculate the best-fitting linear regression line in two ways
  • Use the best-fitting line to make proper predictions
  • Identify how well a regression line fits using r, scatterplot, and R-squared
  • Calculate the residual for a point on the line and interpret it

Chapter 6 Learning Objectives
After reading this chapter, students will be able to:

  • Explain how probability is used in business
  • Define the basic probability concepts of sample space, outcome, event, probability, and probability distribution
  • Recognize and solve “or,” “and,” and “not” conditional probabilities using probability rules
  • Solve probabilities for joint and disjoint events
  • Use a two-way table containing probabilities to find marginal, conditional, and joint probabilities
  • Solve marginal probability problems using the Law of Total Probability
  • Solve conditional probability problems using Bayes’ Rule
  • Use trees and tables to solve probability problems in conjunction with the probability rules
  • Explain and check for independence using any of the three ways presented

Chapter 7 Learning Objectives
After reading this chapter, students will be able to:

  • Discuss how the normal distribution is applied in business
  • Describe the characteristics of a normal distribution
  • Use the 68-95-99.7% Rule, also known as the Empirical Rule
  • Draw pictures of various normal distributions, including their means and standard deviations
  • Describe the Z-distribution (standard normal distribution) and the meaning of its values (Z-scores)
  • Find probabilities and percentiles for the Z-distribution
  • Convert from an X-value on a normal distribution to a Z-value on the standard normal distribution, and vice versa
  • Find probabilities and percentiles for values on any normal distribution

Chapter 8 Learning Objectives
After reading this chapter, students will be able to:

  • Explain how the binomial distribution is applied in business
  • List the characteristics of a binomial distribution
  • Find and interpret the mean and standard deviation for the binomial distribution
  • Find probabilities for the binomial distribution in the “small and medium n” cases using the probability formula and the binomial table
  • Find probabilities for the binomial distribution in the “large enough n” case using the normal approximation, and explain why the approximation works
  • Describe how the shape of the binomial distribution changes with different values of n and p
  • Describe how the standard deviation of the binomial distribution changes with different values of n and p

Chapter 9 Learning Objectives
After reading this chapter, students will be able to:

  • Recognize the basic premise that sample results vary from sample to sample
  • Define the basic process of inference
  • Explain what a sampling distribution is and why it is important for inference
  • Identify the characteristics of the sampling distribution of X̅: its mean, its standard deviation (standard error), and its shape (two cases)
  • Recognize that the mean of X̅ is μ = μX and the standard error of X̅ is 
  • Describe how the population standard deviation, σX, and the sample size, n, affect the standard error of X̅
  • Explain how the shape of X̅ has a normal distribution if the original population is normal
  • Explain how the shape of X̅ has an approximate normal distribution if the original population is not normal and n is large enough (at least 30)
  • Solve problems involving X̅ to find probabilities for the sample mean

Chapter 10 Learning Objectives
After reading this chapter, students will be able to:

  • Define a confidence interval and state what it is used for in business
  • Recognize that the components of a confidence interval are a sample statistic plus or minus a margin of error
  • Explain what (1 − α) means in terms of the confidence level of a confidence interval and how it relates to z*
  • Memorize the formula   for a (1 − α)% confidence interval for the population mean (when the population standard deviation is known)
  • Interpret a confidence interval correctly
  • Identify the three components of the margin of error and explain how each one of them affects the margin of error and hence the width of the confidence interval
  • Solve problems involving a confidence interval to estimate the population mean
  • Find the sample size necessary to achieve a certain margin of error before conducting a study

Chapter 11 Learning Objectives
After reading this chapter, students will be able to:

  • Define a hypothesis test and its role in business
  • Construct the null and alternative hypotheses
  • Calculate and interpret the test statistic
  • Find and interpret the p-value
  • Make decisions regarding Ho and draw conclusions in the context of the problem
  • Recognize the impact of Type I and Type II errors
  • Realize the cautions involved in using p-values as provided by the American Statistical Association

Chapter 12 Learning Objectives
After reading this chapter, students will be able to:

  • Describe the properties of the t-distribution
  • Find appropriate values and probabilities on the t-table
  • Conduct a t-test for the population mean when sigma is unknown
  • Calculate a confidence interval for the population mean when sigma is unknown
  • Explain how hypothesis tests and confidence intervals are connected

Chapter 13 Learning Objectives
After reading this chapter, students will be able to:

  • Describe how hypothesis tests and confidence intervals for population proportions are used in business
  • State the conditions needed to conduct a hypothesis test and confidence interval for a population proportion
  • Conduct hypothesis tests and confidence intervals for a population proportion
  • Explain the factors that affect margin of error in a confidence interval for a population proportion
  • Use the shorthand method for calculating a conservative margin of error for a population proportion when only the sample size is known

Chapter 14 Learning Objectives
After reading this chapter, students will be able to:

  • Explain how ethics applies to statistics in the business world
  • Evaluate how to choose the right study and the right analysis for a particular statistical job
  • Recognize the limitations of your study
  • Use ethics and correctness as a guide when doing your own statistics and looking at other people’s work

Educator Resources

The courseware’s materials make teaching business statistics easier for you and more engaging for students. The following resources are included:

  • Auto-graded quizzes for each chapter

  • Quiz review slides

  • Turnkey assignments

  • In-text interactions

  • Lecture slide decks

  • Lesson plans

  • Engaging, author-led video content

  • Real-world examples

  • Midterm and final exam

  • Test bank

  • Sample syllabus and course calendars

  • Cumulative glossary for student reference

  • LMS integration with Stukent platforms

Expand Your Definition of Courseware

Updated Every Year

Current content for the modern classroom.

Keep Your Content Current

The media and materials included with the “Introductory Business Statistics” courseware make it a robust teaching tool. The content is updated annually so you can be sure you’re teaching up-to-date principles.

Stukent Support Team

with a 96% customer service satisfaction rating

Support for Students and Educators

The Stukent Support Team simplifies the learning process for students and educators. Anyone using Stukent courseware and Simternships has access to our support team to answer any courseware and technical-specific inquiries.

Introductory Business Statistics Bundle

Business Statistics Simulation and Textbook

Courseware + Simternship™

We’re helping instructors create a better learning environment for students, which helps students come to class excited to learn. Our courseware is not just a textbook, it’s a turnkey course — we offer instructors the whole package.

COMING SOON! Part of that package includes the forthcoming Business Statistics Simternship™, a real-world simulation that allows students to complete job-related tasks in a real-world setting.

The “Introductory Business Statistics” courseware will pair seamlessly with the Business Statistics Simternship.

About the Authors

Dr. Deborah Rumsey

Dr. Deborah Rumsey

Dr. Deborah Rumsey is a Teaching Professor at the Ohio State University in the department of statistics. She is a Fellow of the American Statistical Association. She is also a founding member of CAUSE, the Consortium for the Advancement of Undergraduate Statistics Education, and the conference designer and four-time program chair for USCOTS, the United States Conference on Teaching Statistics.

She has written several books in the “For Dummies” series, including Statistics for Dummies, Statistics II for Dummies, Probability for Dummies, and Statistics Workbook for Dummies. These books are published in several languages and are popular around the world.

Dr. Rumsey teaches and coordinates a large-scale introductory course in business statistics for all types of business majors, with a total of over 80,000 students taught in her career. She has taught online courses as well as in-person courses. Her scholarly interests include statistics education; in particular, writing, teacher training and support, student learning, and designing classroom spaces. Her personal interests include fishing, traveling, and spending time on her farm with her family.

Kythrie Silva

Kythrie Silva

Kythrie Silva has 25+ years of experience in higher education and corporate learning and development. While at Ohio State University, she partnered with the department of statistics to teach faculty to design course materials, investigate new ways to use technology, and design technology-enhanced learning environments.

Currently, she manages a global team of instructional designers and developers who support business strategy and employee development at Cardinal Health, a Fortune 15 healthcare company. With a relentless focus on employee skill development, her team is responsible for the design and development of programs across the enterprise, from leadership and professional development to clinical continuing education to finance and sales, including the creative services team responsible for learning design guidelines, templates, graphics, video, and learner experience design. Programs created by her team deliver business results, and several have won Brandon Hall Group HCM Excellence in Learning Awards.

Her professional interests include the application of Design Thinking and UX methodologies to create great learning experiences with performance improvement results. Her personal interests include crafting, reading, traveling, and spending time with her family.

Simplify Education

with LMS Integration

Single Sign-on   |   Rostering   |   Grade Book Syncing​  |  Deep Linking

Canvas logo
logo_brightboard
logo_moodle
D2L-Brightspace
Schoology LMS Logo

Related Courses

Courseware + Simternship

Courseware + Simternship

Courseware + Simternship

FREE Sample Syllabus:
Introductory Business Statistics

Who doesn’t love free stuff? Hundreds of instructors are using this syllabus for their course, teaching the real-life applications of Business Statistics.