


The Stukent Business Analytics Simternship
Transform classroom theory into data-driven decision-making
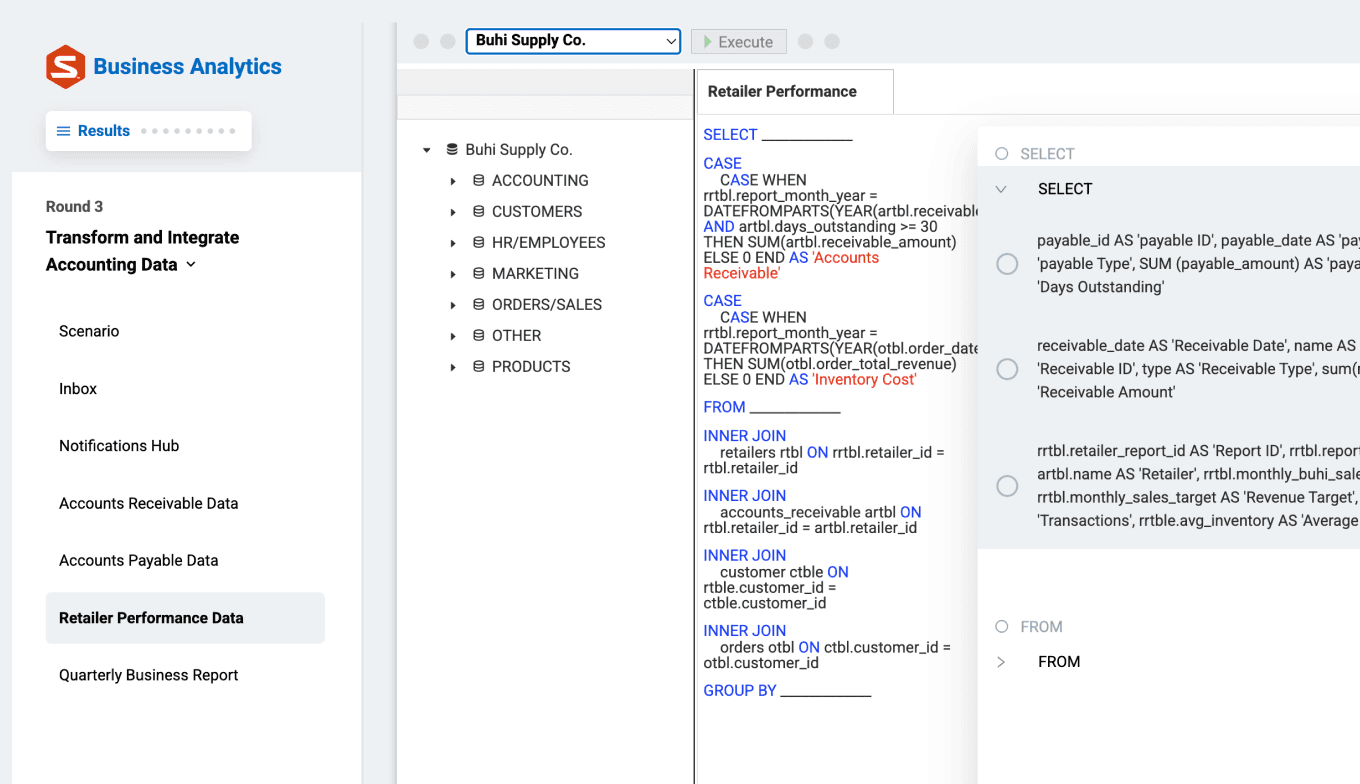
Empower your students with the tools to make informed business decisions. The Stukent® Business Analytics Simternship® places students in the role of a data analyst, challenging them to interpret real-world data sets, forecast trends, and present actionable insights.
Pair the simulation with the “Business Analytics” courseware to help students connect analytical theory to strategic, real-world applications and prepare them to excel in data-driven careers.

Build students’ skills with a Simternship
Help your students practice data-driven decision-making through realistic datasets and hands-on business scenarios. Each round builds essential technical and strategic skills, empowering students to turn raw information into meaningful insights.


Brennan Davis, Ph.D.
The “Business Analytics” courseware
Business analytics grounded in real-world applications
Give your students a competitive advantage with the“Business Analytics” courseware. This comprehensive resource equips learners with foundational skills in Python, R, Excel, and Tableau. With 100+ exercises and 20 diverse data sets, your students will tackle both structured and unstructured data challenges and develop marketable skill sets.

“Dr. Davis’ textbook highlights key data visualization and analytics tools that data-centric companies are eagerly searching for in potential employees.”
Alex D., National Football League
Preview
Explore the table of contents
The “Business Analytics” courseware helps students learn how to harness the power of data throughout any industry by mastering SQL and NoSQL databases, utilizing machine learning and deep learning for advanced analytics, and effectively visualizing their findings through professional data storytelling techniques.
Chapter 1: Business Analytics
Chapter 2: Spreadsheet and Programming Tools for Business Analytics
Chapter 3: Unstructured Data and NoSQL
Chapter 4: Structured Data and SQL
Chapter 5: Data Mining with Cluster Analysis
Chapter 6: A/B Testing Essential Business Factors
Chapter 7: Machine Learning and Deep Learning
Chapter 8: Cloud Services
Chapter 9: Web Analytics
Chapter 10: Analytics for the Internet of Things
Chapter 11: Storytelling through Visualization
Chapter 12: Predictive Analytics with Regression
Chapter 13: Prescriptive Analytics with Optimization
Chapter 14: Accounting & Finance Analytics
Chapter 15: Marketing and Sales Analytics
Chapter 16: Operations and Supply Chain Analytics
Chapter 17: People Analytics


About the author
Brennan Davis, Ph.D.
Professor and Director of the Master of Science in Business Analytics program, California Polytechnic State University
Dr. Brennan Davis is the Professor and Director of the Master of Science in Business Analytics program at the Orfalea College of Business, California Polytechnic State University. With over a decade dedicated to curriculum development and hands-on classroom teaching, Brennan has profoundly impacted the educational framework for aspiring business analytics professionals. His extensive industry experience, spanning eight years in business management across the automotive and technology sectors, imbues his academic instruction with practical insights that resonate with current market needs.
Through his visionary leadership and innovative course design, Brennan equips students with the critical skills necessary for excelling in dynamic and competitive business environments, bridging the gap between data analytics and strategic business decision-making.
Instructor support you can count on
With a 96.4% satisfaction rate and an average response time under 10 minutes, the Stukent Support Team and customer success managers ensure you can focus on teaching.
Always have the latest edition
The “Business Analytics” courseware contains robust instructional resources for educators and students. Best of all, the Stukent team updates the courseware annually, which means your curriculum will always be on the cutting edge of industry.